TradingView Indicator Performance - Part 2
Thank you for the amazing responses. If you haven't already then do read the Intro and Part 1 first. They're important.
Rollout plans are on track as mentioned in the earlier posts.
Before we get to the TradFi backtests let's address some of the repeated questions that were received.
If you are only interested in the results of the indicator then skip to the next section.
- You mentioned indicator is only for All-Access Members. Will they also receive logic/source code to make modifications?
NO. All-Access subs will only receive access to the indicator when it's ready. No source code or anything else. The only thing you would be able to change is the color of the bands. It's built that way to save you from yourself.
- Why is a Monthly subscription not available anymore?
Even though the models were developed in the last cycle and the results were very good too,
Web3Quant was only launched (May 2022) in the midst of a brutal bear. This was to ensure the system was robust and worked both in bull and bear cycles and Not just a bull market wonder like many.
Before going premium, everything was kept FREE for a year with model positions and results posted every week consistently. To ensure the live results also match up.
Similarly, the Monthly option was kept open till the premium sub was proven.
Now there's consistent feedback for a while that many subs have made multiples of the subscription fees in a relatively short span.
From here on, the focus would be to deliver new features and on long-term committed users.
Also for the stuff I have planned for the future, it would make sense to have an exclusive community.
- You answered the WHAT (problem) and HOW (solution) but not the WHY (are you doing this).
- Subs don't need to wait for updates. They can easily execute Entry/Exits on LTF and on other assets that are not covered by updates.
Also during the heated bull phase or due to being in different time zones, it's hard to sometimes get optimal entries thus missing the trade altogether. This would allow them to enter on pullbacks and execute consistently without getting caught in emotions. - Allows me to freely share more real-time LTF trades on Twitter / AMAs on charts using the same indicator as the subs have, without worrying about diluting value for paid subs.
Give a man a fish, and you feed him for a day; teach a man to fish and you feed him for a lifetime.
- I would like to do more educational posts and share real traders POV. But I don't believe in just theory. I would be using this indicator to explain different strategies that are Simple. Practical. Effective.
Most people think you need to be some kind of nerd or Ivy League pass-out to be a successful trader/quant.
NO. You can pretty much outperform the majority by doing simple stuff.
Crypto is a good example itself. Institutions are 10 years late. Even in the early days most "pros" were short Tesla, it was retail who were early to that too.
- How is it different from the W3Q model?
Trading is all about answering only 3 questions. Thats it.
WHAT? WHEN? HOW? to buy/sell.
How much aka allocation is very personal to each individual but the
WHAT and WHEN can be standardized. Hence Web3Quant only focuses on those.
What - is solved by a quantitative scanner. It signals what coins to long/short. This is critical as everyone has a finite capital but there are 1000s of new Coins/Stocks.
When - is solved by a signaling indicator.
NOTE: You are NOT getting access to the scanner or the indicator that I use ( that will not be made public). Those insights will only be shared via the regular updates.
Instead, this is an indicator developed for the subs specifically.
In the spirit of transparency, let me explain the difference between the 2 indicators with an example of Photography.
Consider the W3Q model like a DSLR camera with various lenses.
Just like each lens has a specialized purpose like portraits or landscapes. Each algo is optimized for different asset classes, timeframes, or settings. It includes complex features like reversals and varied weightage criteria etc.
On the other hand, the subscriber indicator is like a smartphone camera. It's designed to work effectively 'out of the box', requiring no "expert" knowledge, and is applicable across ALL assets and timeframes.
While a DSLR might offer more advanced features, a smartphone camera is often more useful for the average person. (even if it can achieve 70-80%) of the DSLR results. Coz it's always accessible when the picture-perfect moment arrives.
Similarly, you would be better served with a simple but effective tool while trading than a bunch of professional tools with 10 screens. Those only lead to analysis paralysis for the average Joe.
I want to reiterate that this indicator, don't want to make it sound like it's any more than what it's supposed to be.
like any tool, is not a magical solution. It's a part of a broader strategy. The scanner, for instance, is just as crucial, if not more so.
Also, you can achieve 70% of the results with a simple moving average crossover or a super-trend indicator with smoothed settings.
Most folks who SELL their indicators/trading systems have some form of the above.
Without the curated scanner output and/or some form of insights and updates, they don't add any more value than a simple crossover would IMO.
That is why at W3Q it's not a separate product. Instead, as a value-add to an existing product.
I can easily make a lot more by advertising it as a silver bullet but I intend to play the long game
hence will only do what I believe is in the best interest of my subs/followers.
Only someone who tried to develop these models would tell you pain points and that the effort & difficulty go exponentially higher when you try to improve the results from 70% -> 80% -> 90%.
Even a delay of a couple of price candlesticks can make a strategy non-profitable.
That is the reason crossovers/supertrends aren't profitable as a system unless one is a discretionary trader.
- What about your followers who cannot afford a subscription?
I have always tried to give as much as I can. The long-form posts such as the Crypto stock investment thesis and Crypto Bull thesis were sent out for FREE to all. Many picks are up multiple X since published.
Regularly I tweet about LTF breakouts which many have found value in. Will do more of those using the indicator. This way many can visualize it helping them size the trades, etc.
Will do more chart request sessions for all on Twitter using the indicator if that's of interest.
Lastly, the referral program is now open to all.
It’s my way of saying thank you to those who help spread the word.
Kept it simple and rewarding too. More details are on the page.
Refer 3 friends, and Get an All Access subscription worth $3000.
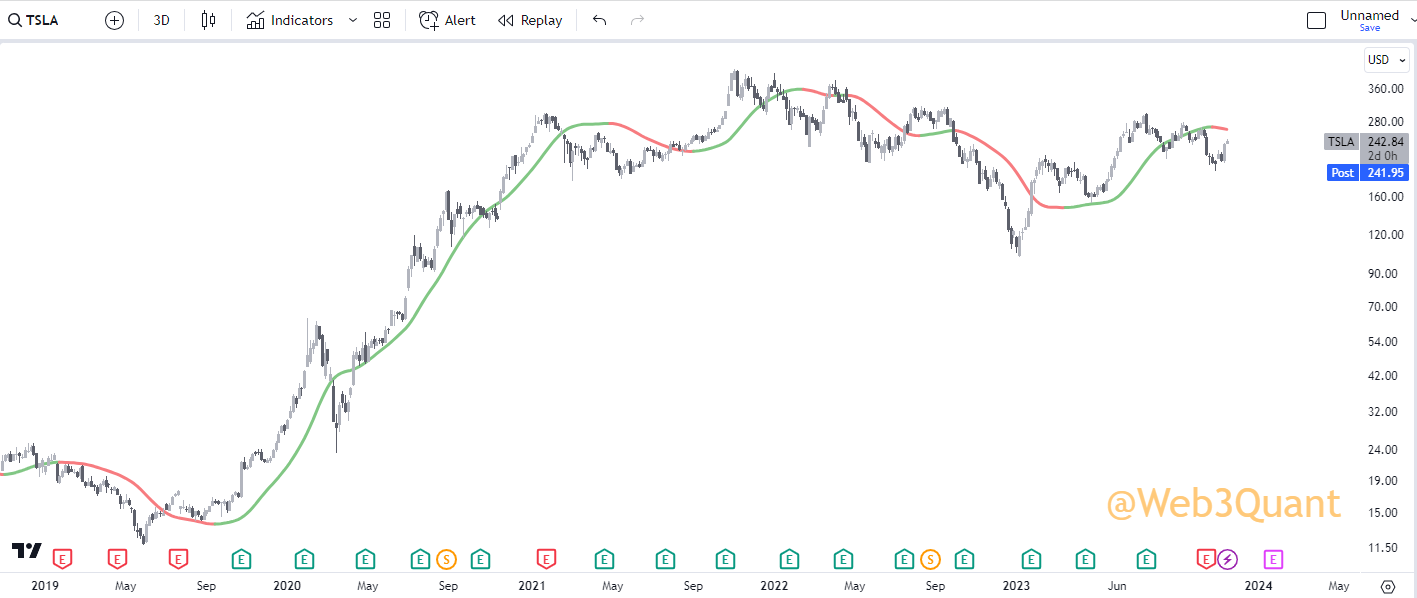
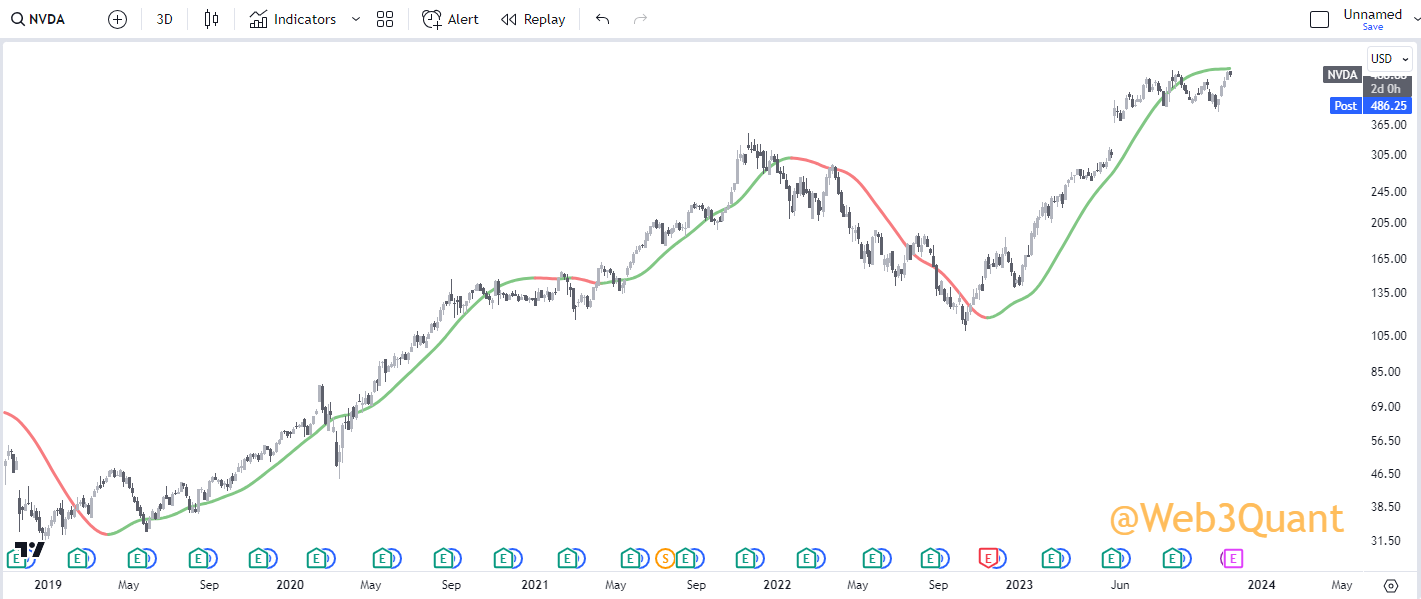
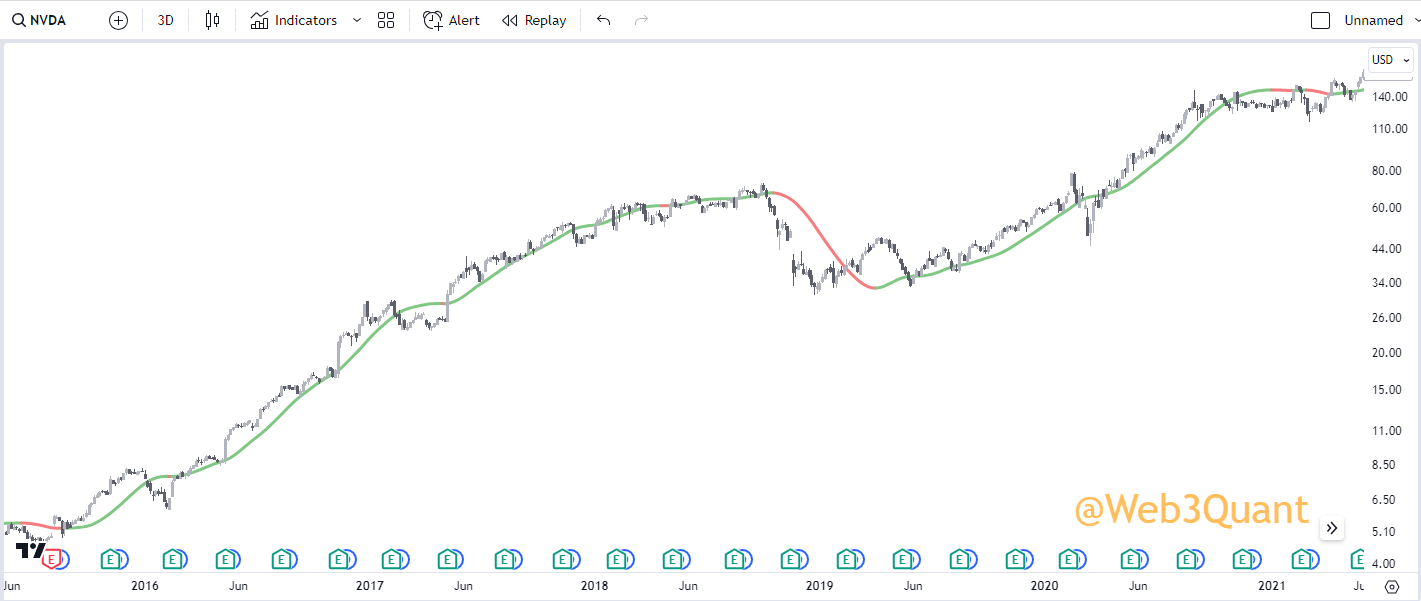
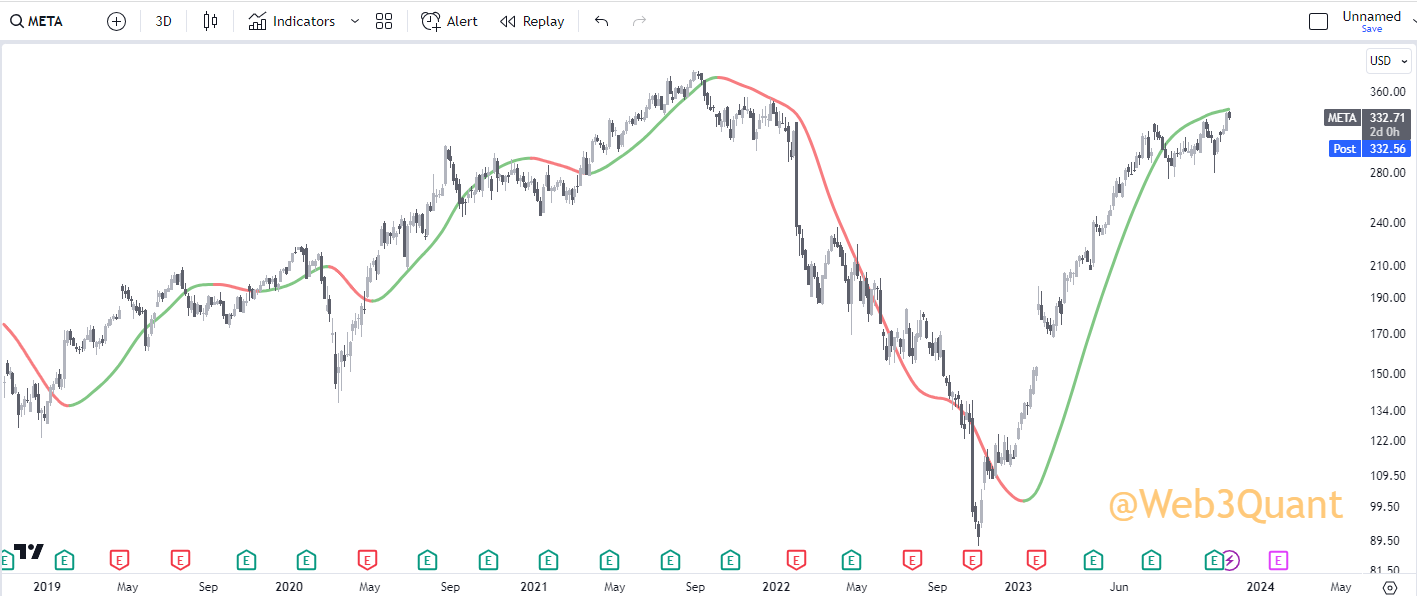
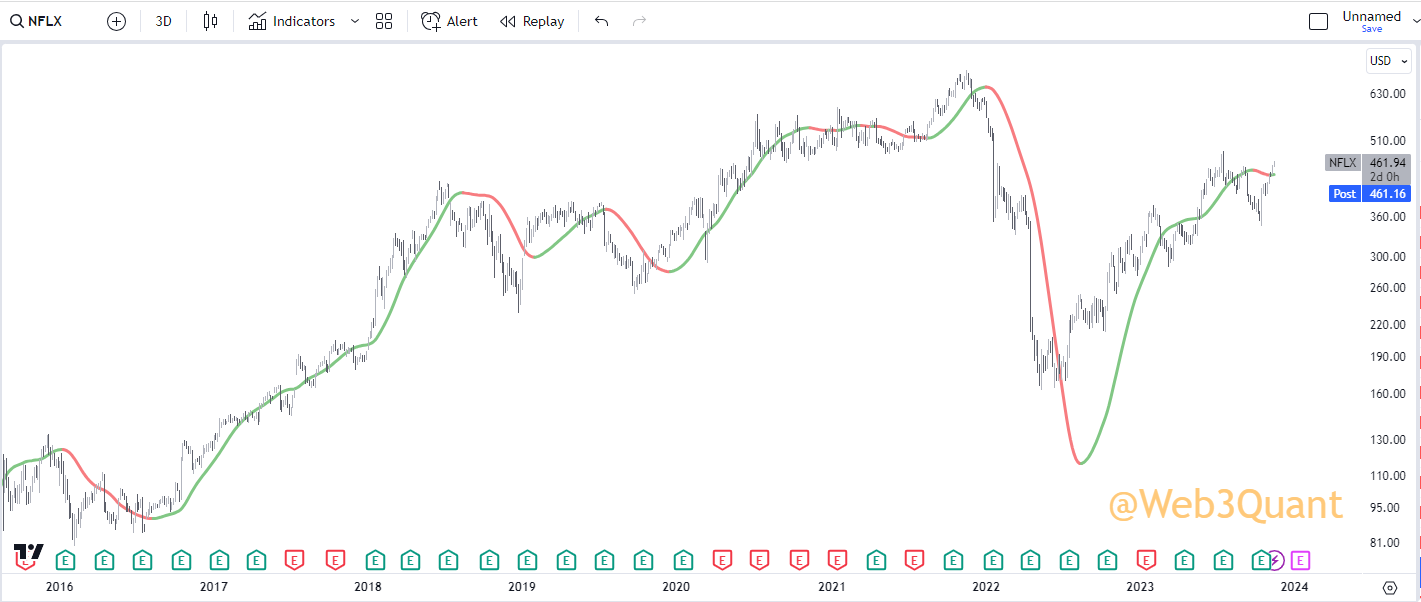
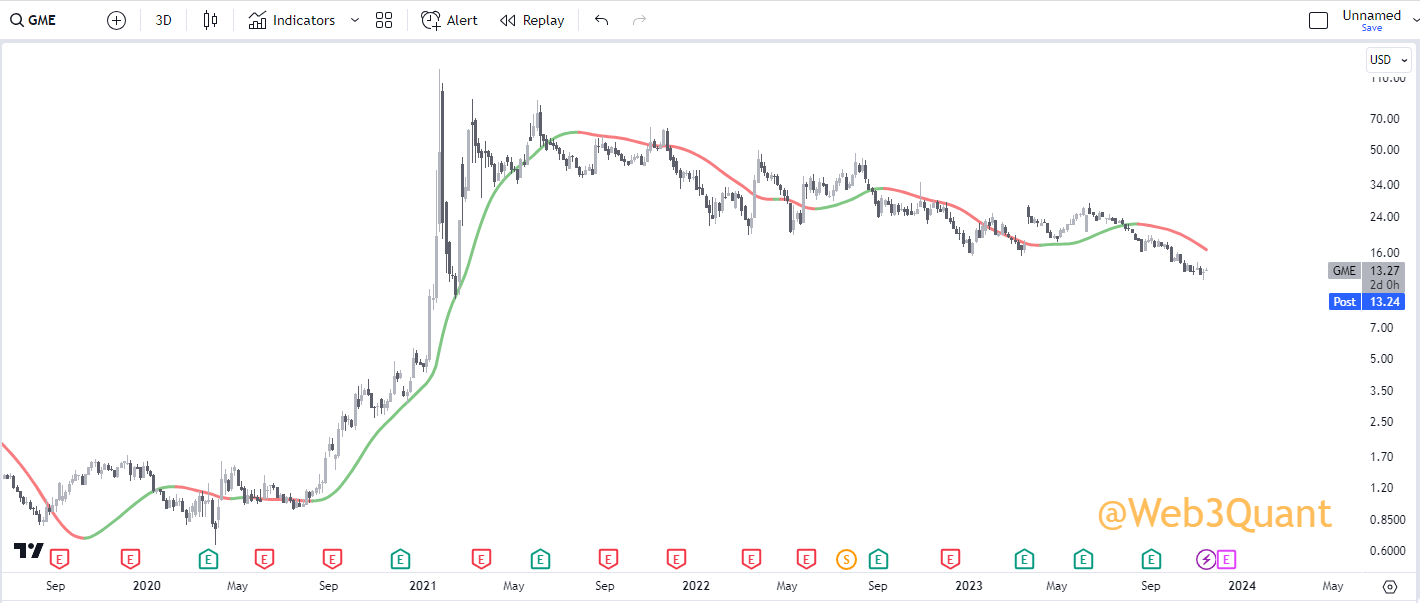
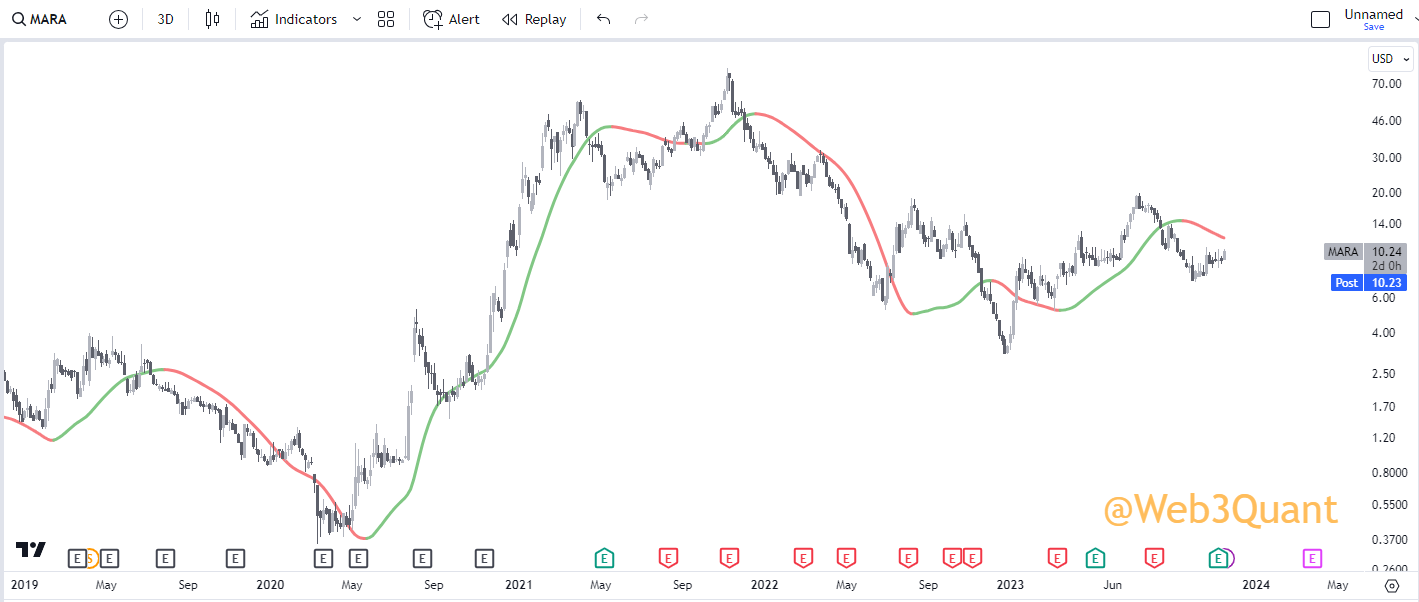
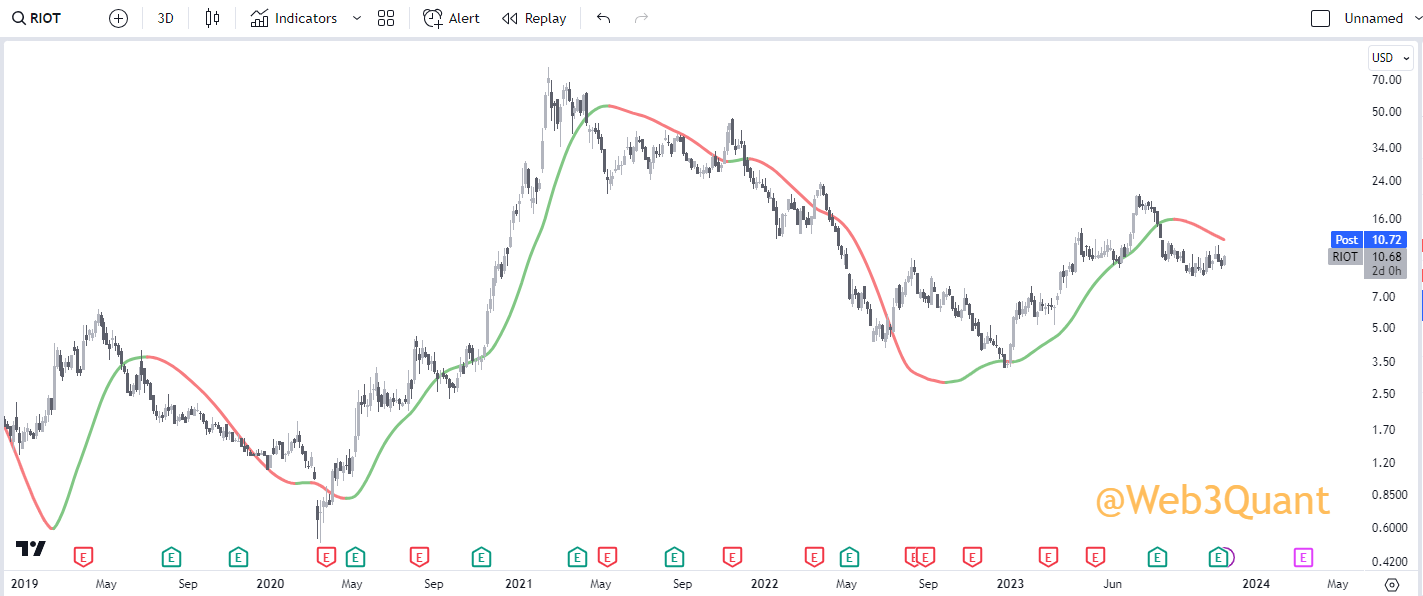
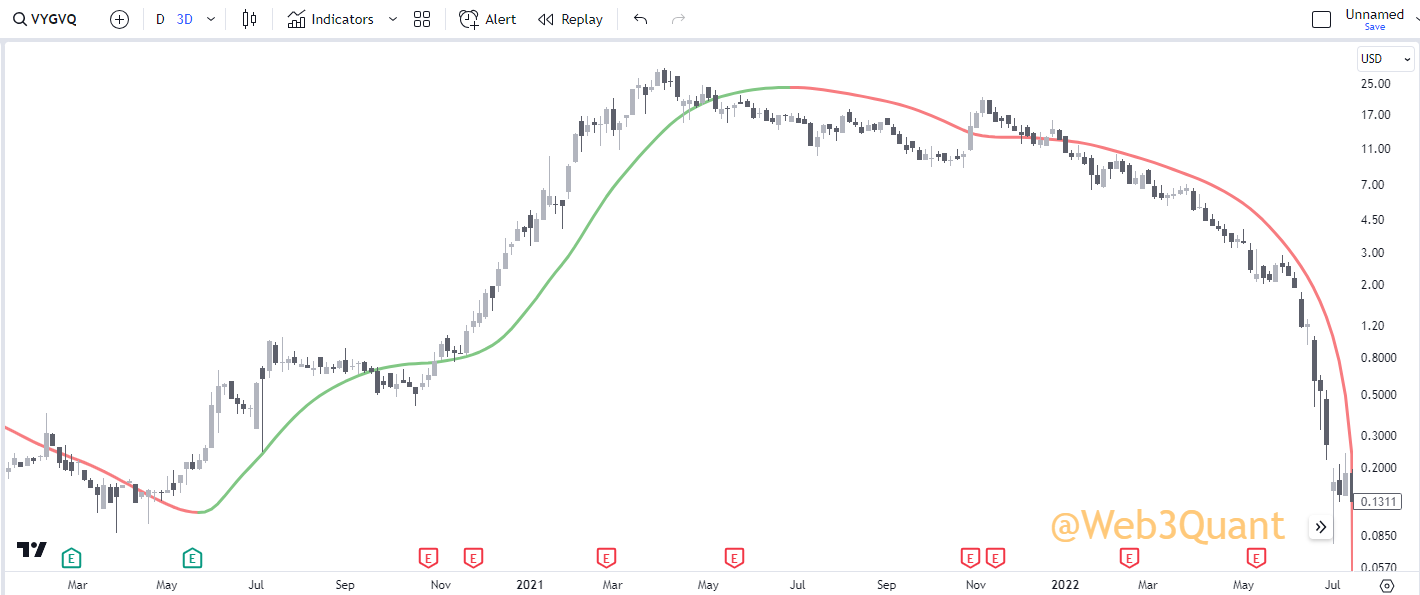
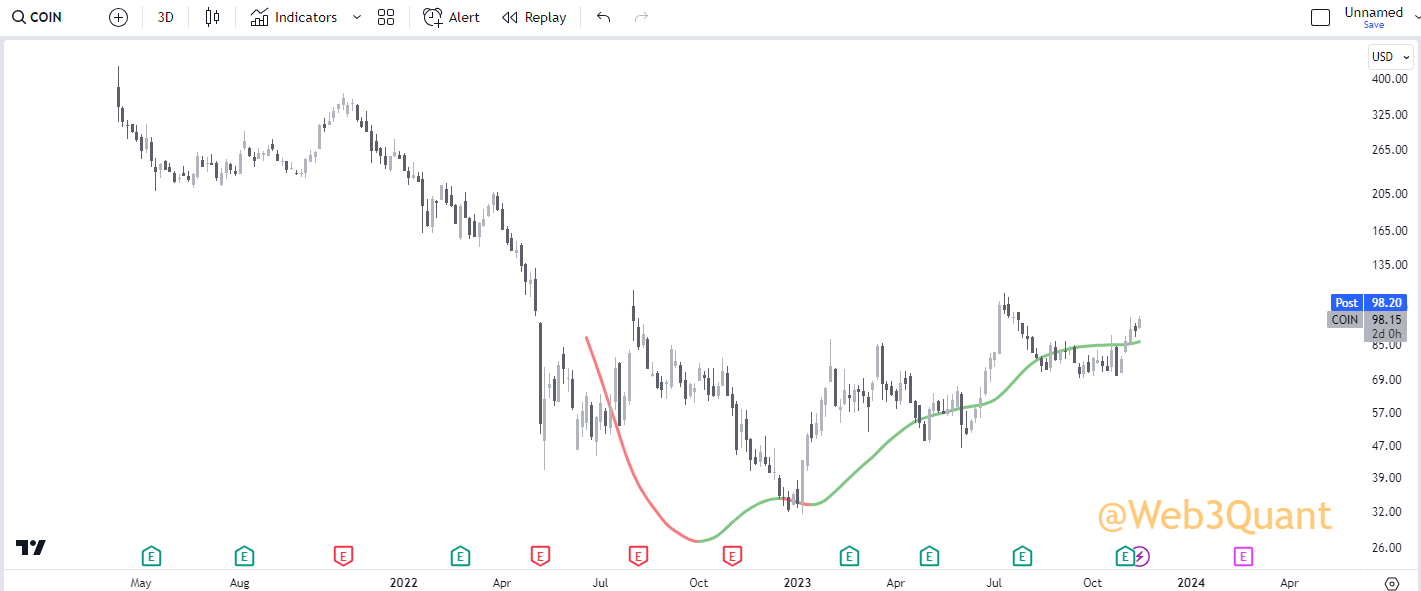
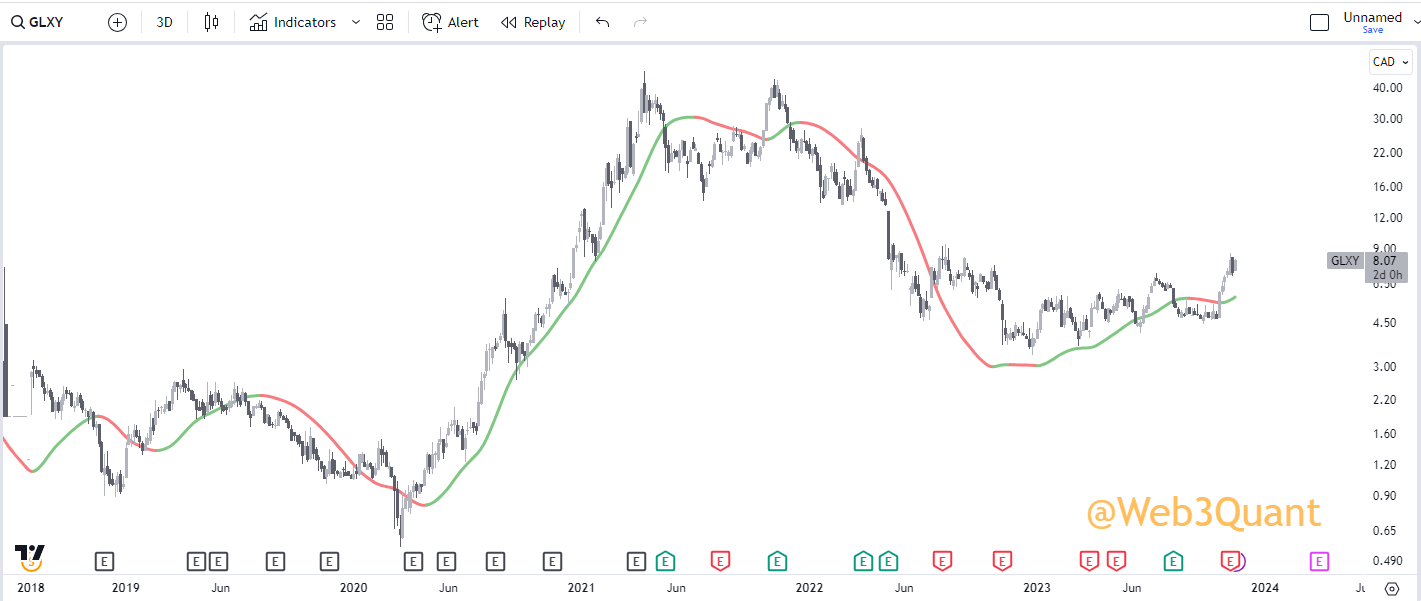
Let's move to the TradFI results. Here we will look at results on a 3Day timeframe to give you a big-picture perspective.
NOTE: This is the exact same indicator you saw in PART 1 with the same settings. Just run on 3Day timeframe.
In the next post will focus on LTFs (1-hour TF) which can be used for Options Trading etc.
MACRO
It's a fascinating subject to discuss at parties and argue with strangers over the internet till your face turns blue.
The reason many "gurus" get away with saying anything coz it can take years for something to play out and by then no one remembers what you said anyway.
There are only 2 kinds of people.
1- Those who don't know sh*t about macro.
2- Those who don't know that they don't know sh*t about Macro.
The only folks worth following for Macro are those who use some sort of charts/price action to back their thesis and stitch the story. Coz they are more grounded in reality than fiction.
I choose to go a step ahead and only focus on Data and ignore the story coz I have learned the hard way that
Prices precede narratives and not vice versa.
Show me the price, I will tell you the news.
If the chair of the US Federal Reserve cannot reliably predict how hot inflation can run or what would be the interest rates down the line and chooses to be "Data Driven" then so should you.
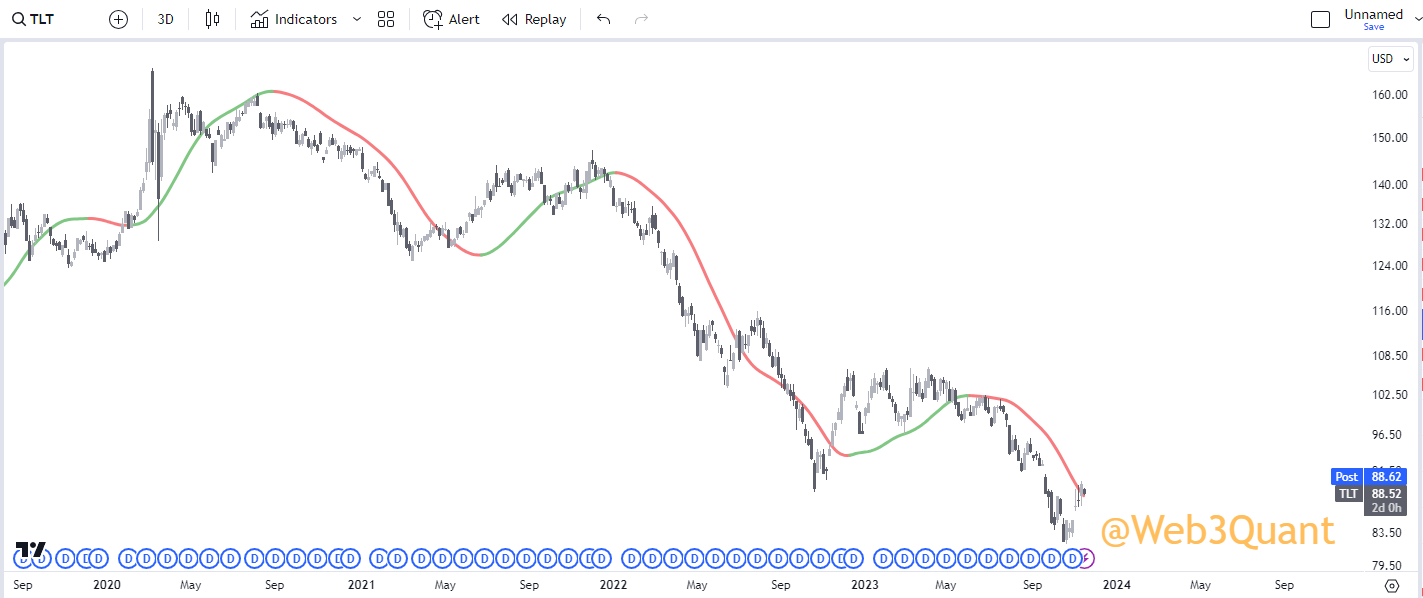
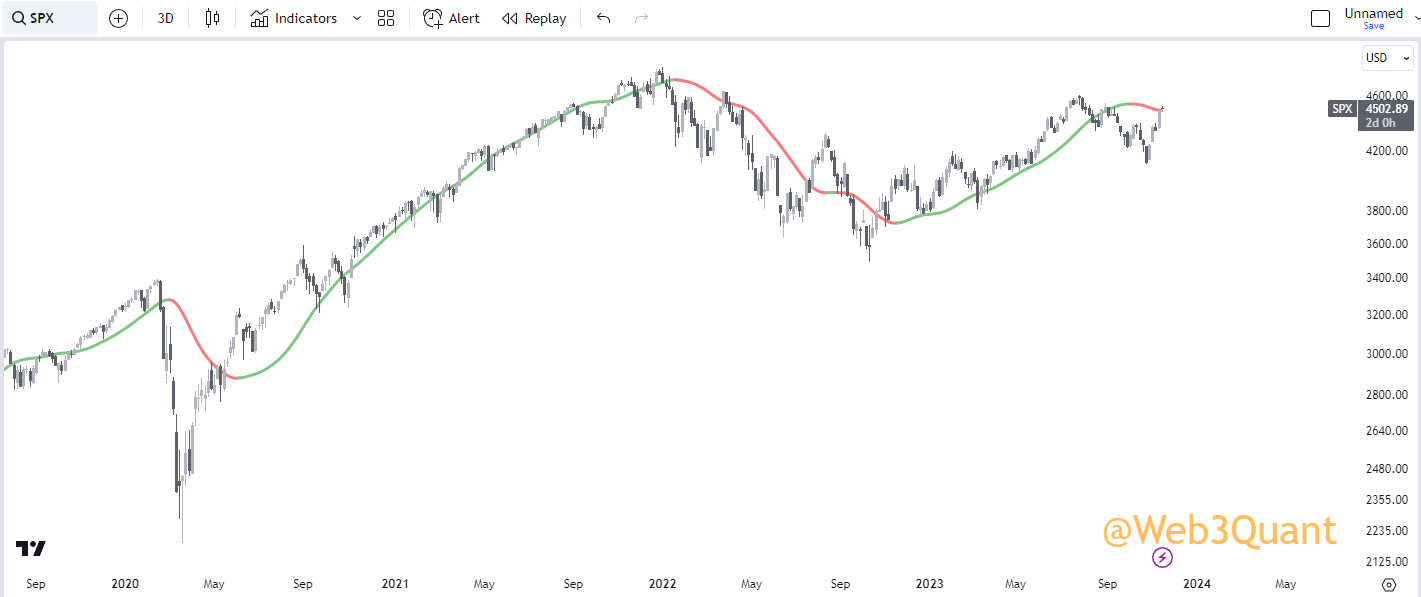
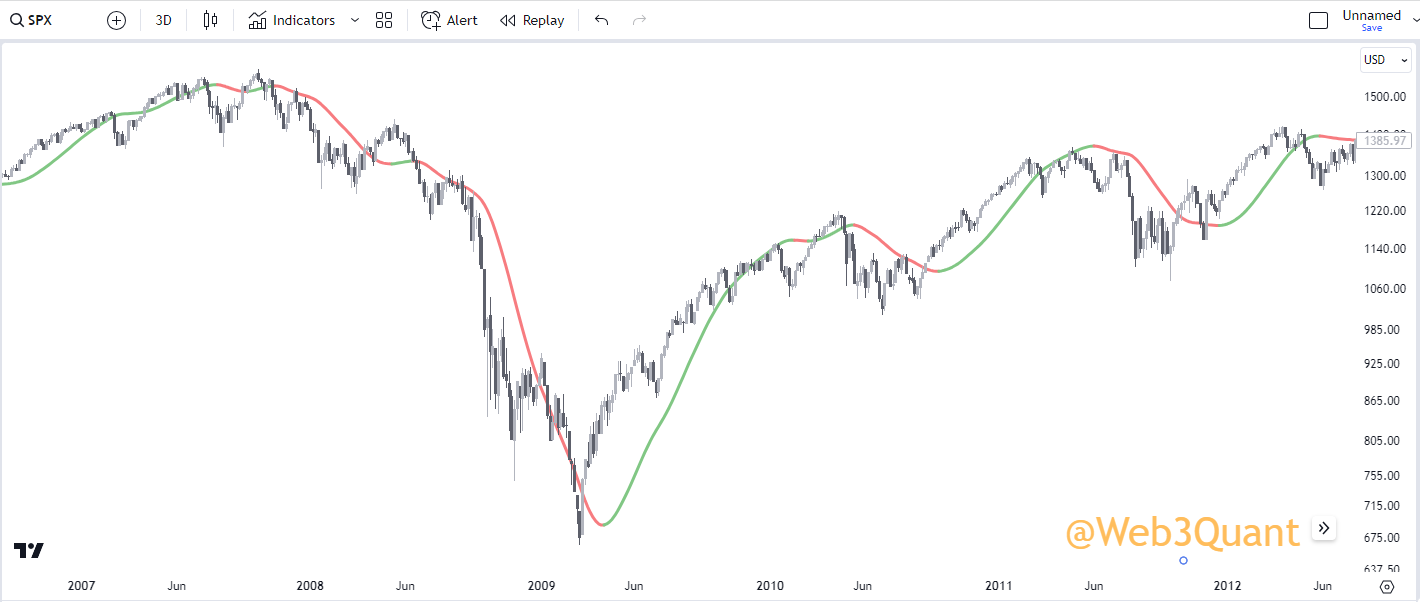
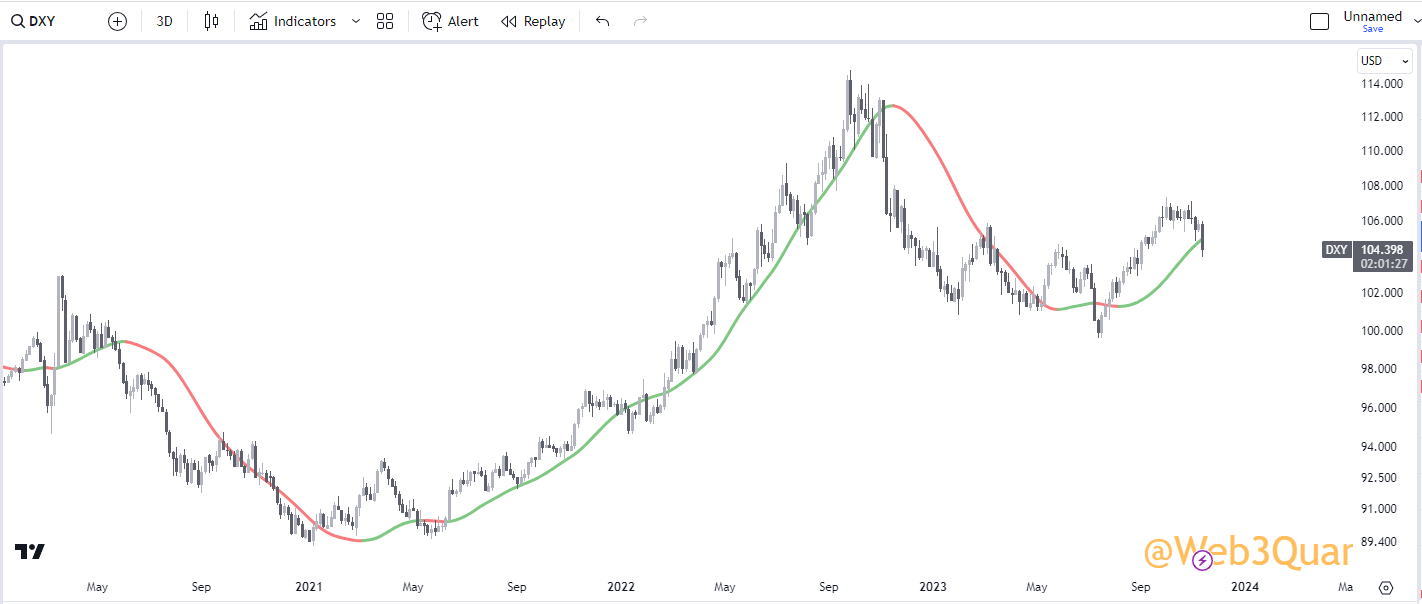
Here are the ONLY 3 macro variables you will ever need to predict everything.
Bond Market (TLT)
Equities (S&P 500)
Worlds Reserve Currency (USD)
See you in PART 3.
** Web3Quant is not registered with any financial regulatory agencies. Web3Quant content is purely for research, education, and entertainment purposes and should NOT be considered personalized financial advice. Do your own research and consult your financial advisor.**