Web3Quant Indicator : How-To Guide
Although this guide is written for Web3Quant indicator the principles can be applied to any trend momentum indicator.
As always it's written for normies in ELI5 format.
This is the 1st version. Will periodically be releasing updates to cover more questions and strategies etc.
Heres some key bullets but you need to read the indicator post to get the context. It's important.
- What makes any indicator useful - One that gives Clean. Definitive. Universal and a consistent signal.
- Problems - Overcrowding, Overfitting, Optimize for Lag or Smoothness?
- Solution - AllInOne. Universal. Simple. Preconfigured. Balanced.
NOTE: You are NOT getting access to the scanner or the indicator that I use ( that will not be made public). Those insights will only be shared via regular updates.
Trading investing is all about answering only 3 questions. Thats it. Rest is just Intellectual masturbation.
WHAT? WHEN? HOW much? to buy/sell.
How much? is very personal to each individual but the
WHAT and WHEN can be standardized. Hence Web3Quant only focuses on those.
What - is solved by a quantitative scanner.
It signals what coins to long/short. This is critical as everyone has a finite capital but there are 1000s of new Coins/Stocks.
When - is solved by a signaling indicator.
Web3Quant indicator is designed to be Simple & objective which can be used by the subs in confluence with the Web3Quant model updates.
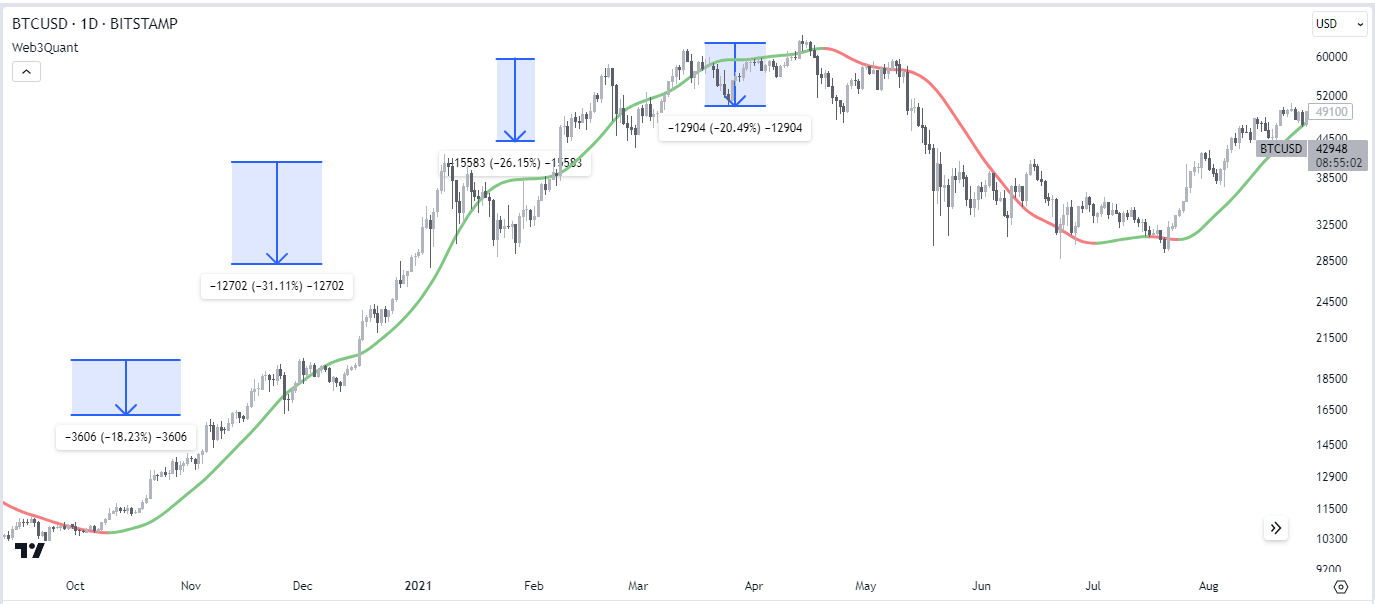
How does the Web3Quant indicator work?
Green indicates a buy; red, a sell. No guesswork.
Those lines also act as support/resistance levels respectively.
Systems Thinking
Most folks get intimidated hearing the word model.
No you don't need to have access to some supercomputer with the fastest internet or some proprietary data.
A lot can be achieved with rule-based systems. It's about doing a lot of little things right than having some mystic settings or magic indicators.
The guy who got the Nobel Prize for efficient market hypothesis has also said the only 2 anomalies to his theory are Value and Momentum and that
momentum is a premier anomaly.
Value is discretionary. You formulate a thesis and trade invest accordingly. I do that too and publish long-form bull thesis
I only believe in timeless principles.
The heikin-Ashi candle which is a trend tool was developed by Japanese rice trader in the 1700s. So yeah
trend and momentum have been known to work for a while and are not a fad or voodoo.
Web3Quant model or systems core pillars are Trend, Momentum, and Relative Strength. This is what is covered via regular model updates and positions.
sometimes value and momentum can be contradictory to each other.
Example: You could have a value thesis that Bitcoin will touch 100K but
your trend system might enter and exit multiple times during that journey.
That is why one is better served by formulating allocation strategies for each style.
Core positions could be via value and trades can be expressed via trend systems.
Even before you get to the tools you need to first adopt the mindset of system trading.
Efficient markets are a lie but you know what's not a lie. Markets are damn smart.
So if you believe you can outsmart the markets all the time then I have some bad news for you.
I have seen countless folks draw squiggles and claim I called this and that. But can you honestly risk manage such trades? Don't answer that.
It does look great when they play out but they aren't useful IMO.
Calling means nothing. Gains are in positioning.
if calling it is all you are after then slap a moving average crossover on your chart and you will outperform all the larps, YouTube, and ticktock traders.
Most profitable traders have nothing exciting to say on a daily basis.
They focus on finding their edge and keep exploiting it.
Sure some gifted individuals call all the moves but that's an exception and not the norm.
The first step is always to surrender to the idea that
Systems > Discretionary
All your intelligence should go in designing the system. once that is done you need to switch off your mind and follow your system.
next step is to accept that systems won't work all the time.
World's best systems have a hit rate of 30%-40% with a high-risk reward and are wildly profitable.
A lot of you want the upside of a model but tend to throw the baby out with the bathwater moment there are sharp reversals.
It doesn't work that way.
So then what are the key principles you need to accept?
- Its in the name Trend following. You will by definition lag on both tops and bottoms.
- You can still be profitable by just catching the meat of the move.
- How much lag? will be based on the timeframe you choose. The higher the timeframe cleaner the signals but you lose more meat and vice versa.
- Market trends 30% of the time and ranges for 70%. Gains are made during the 30% time but you DONT know when those are.
- The chop phase is the real ENEMY of trend systems. there is no way to avoid it. only one can minimize it.
- Few of your winners will take care of the losers.
- The biggest challenge in systems trading is, managing emotions especially when at times you will be right and the system will be wrong.
That's when you tell yourself you want to be the casino and not the player.
The math will ensure you win over time if you consistently and holistically follow the system.
Regime Filter
I spoke a bit about regime filter in the post and the Twitter thread here
in layman's terms is a period when things are easy or hard.
It's like hunting or fishing. Sure you can go hunting anytime but during the period you get more bang for your buck.
I'm sure many of you have heard people say "We are in a bull market" but
how does one even know or quantify it?
A regime filter helps with that. You can do a lot of sophisticated things but I will cover some easy ones that anyone can do right away.
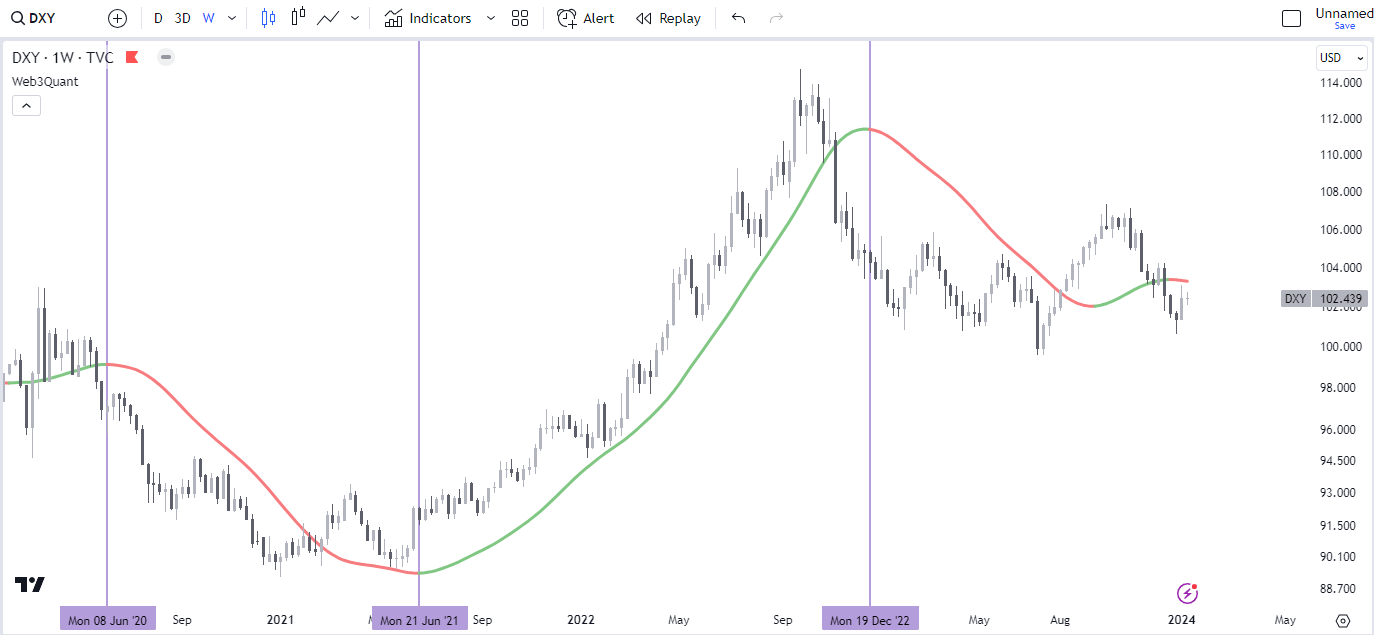
USD is one of the best indicators of risk on and risk off. and it will continue to be so as long as its the world's reserve currency.
This is a weekly DXY chart. Notice when the Web3Quant indicator turned green and red.
One look at the dates and you can immediately tell what those periods meant for crypto bull and bear markets.
A dart-throwing chimp could have made money in the bull market but would give it all back if it kept continuing during the bear.
If you just avoided playing during a hard time. that alone would ensure you get to keep the money you made.
Remember we are not talking about trading DXY itself here we are talking about assessing just the regime.
So what other good tickers for the regime filter?
TOTAL - Overall Crypto
OTHERS - for the Alt season.
The basic idea is you want to track the biggest and the most liquid asset in the area you are interested in trading.
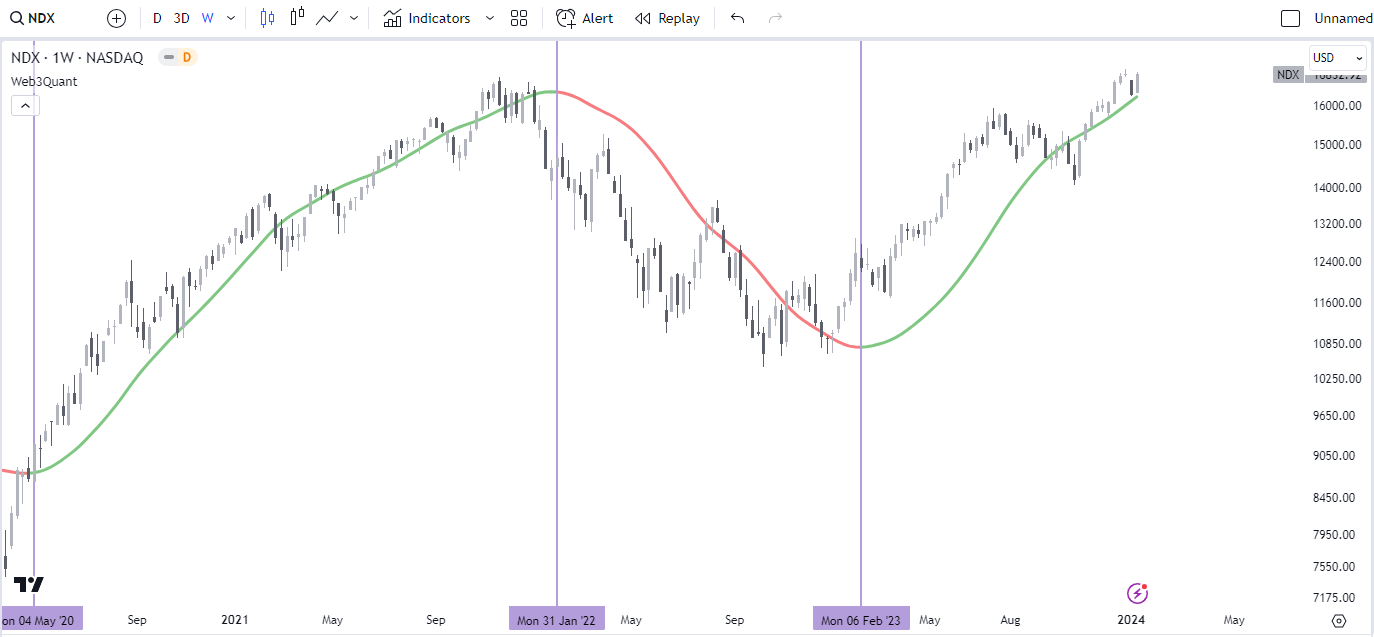
If I were to trade tech stocks then I would look at NDX
TIMEFRAMES
I have seen folks have timeframes on their charts ranging from 5 minutes to yearly.
It can only lead to analysis paralysis coz what is a buy on a one-time frame can be a sell on another.
All you need is a High Time frame (HTF) and a Low Time frame (LTF).
HTF for signals. LTF for entry/exits.
What should be HTF and LTF will vary on the asset class and your style.
As a creator I have chosen to design the indicator to be universal which mean it needs to work on everything but you are not restriced as such.
I will go on a limb and say its unlikely that many of you are trading bonds, forex as well as altcoins and memes.
So ignore everything else and focus on the assets (as a category) you are interested in.
Back-test the web3quant indicator and see what timeframes work.
Here's the thumb rules or guidelines
- More volatile the asset lower the timeframe.
- LTF should be 1/3rd of HTF
So if you are a positional trader then
TradFI - weekly and daily can be good HTF and LTF.
In Crypto
BTC - 3d and Daily
Major Alts - Daily and 8hours
Minor Alts - 12h and 4 hours
Crypto Stocks trade more like crypto than Tradfi so Daily and 4 hour makes more sense there too.
If you are more of a swing trader then
Daily and 4 hours are good TF as HTF and LTF for most assets.
SCANNER
Earlier I mentioned the scanner. It solves the "What" to buy/sell aspect.
Give someone a fish and you feed them for a day. Teach them how to fish and you feed them for a lifetime
I have always believed in both giving the fish and teaching how to fish.
At some point I aim to build a scanner for the subs too but it's a lot harder than the indicator. So let's see how we get along with that.
Web3Quant updates and even on Twitter I speak of a lot coins so could just follow that but always good to build your tools too.
When the going gets good most trend indicators will signal a buy. Web3Quant indicator is no exception.
Having a good scanner ensures you go long a coin that has more upside than the others.
Thats where the relative strength kicks in.
Heres a tip.
RSI is a really good indicator but most people use RSI the wrong way.
They use it as an overbought and oversold indicator.
Something can stay overbought or oversold for a long time.
in fact, the vertical move on a coin or stock happens after it's overbought and vice versa.
Weekly RSI > 50 is a good filter to screen out coins with high momentum.
NOTE: This is just basic and a start if you don't know where to. Don't go and long all coins above RSI 50. It won't work.
STOP LOSS
Most profitable traders know their invalidation and exit plan even before they get into the trade.
Whatever timeframe you are operating on.
use the swing low of the TF as the initial stop loss (SL).
The stop loss doesn't need to be static. One should use trailing SL.
As the price of the asset moves in your favor. Keep moving your SL up.
Heres an example.
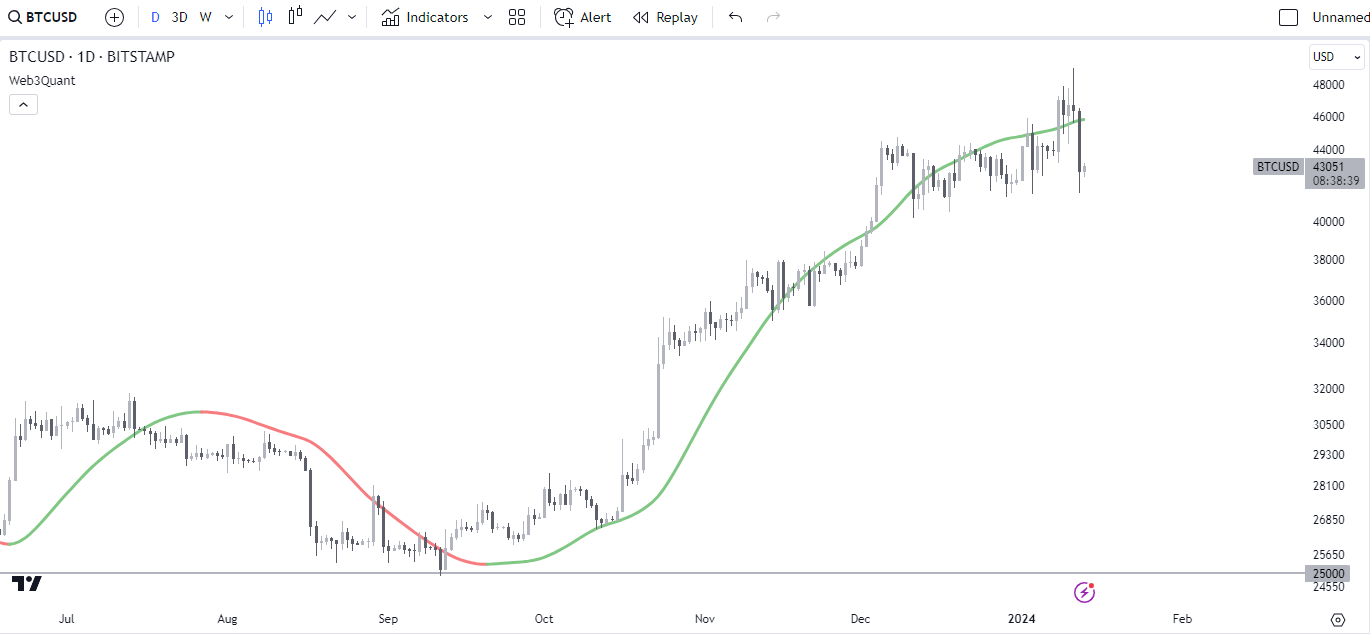
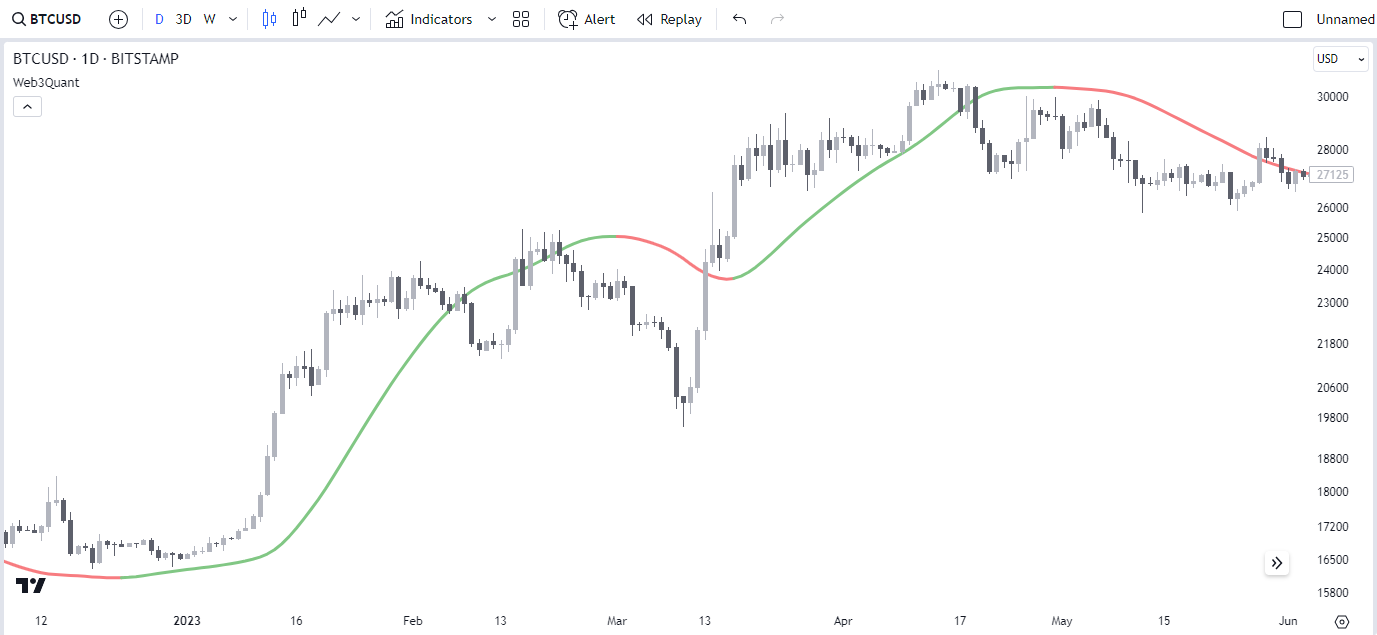
We got the last signal to go long BTC in Sept.
Initial SL would have been 25K moving up to 40K currently.
ENTRY and EXIT.
Web3Quant indicator line also acts as support during uptrends and resistance during downtrends.
Best entries and exits are the one that are made as close to those lines as possible.
Accept that it won't be perfect. you need to spread them out and be broadly aligned with the trend.
Using the same above BTC example. We got the exit signal in July at around 29K.
Exit need not be made as soon as the signal is generated. In this case, there was ample time to exit till the 30s.
For entry the same. The latest signal was in Sept at 27K and there was enough time to accumulate the next few days till 26K.
During instances where you have missed the earlier signal and want to enter positions.
You get periodic chances during pullbacks in an uptrend.
In this case it was in Nov in low 30s and again in Dec in low 40s.
But its not fair if we only looked at a clean signal.
So lets look at a failed one too.
We got nice entry end of 2022 and we were in the trade till march. This is when we got a USDC depeg scare.
Now in hindsight, we can always tell. that was easy, we should have stayed in the trade. Its circle after all they would have sorted the issue bla bla.
All of that is fine but its called discretionary trading. You would have said the same thing about FTX before the whole truth came out.
The whole idea is you don't make decisions.
In this case, you would have exited lower and had to renter higher. Part of the game.
PROFIT BOOKING
This is always the hardest question.
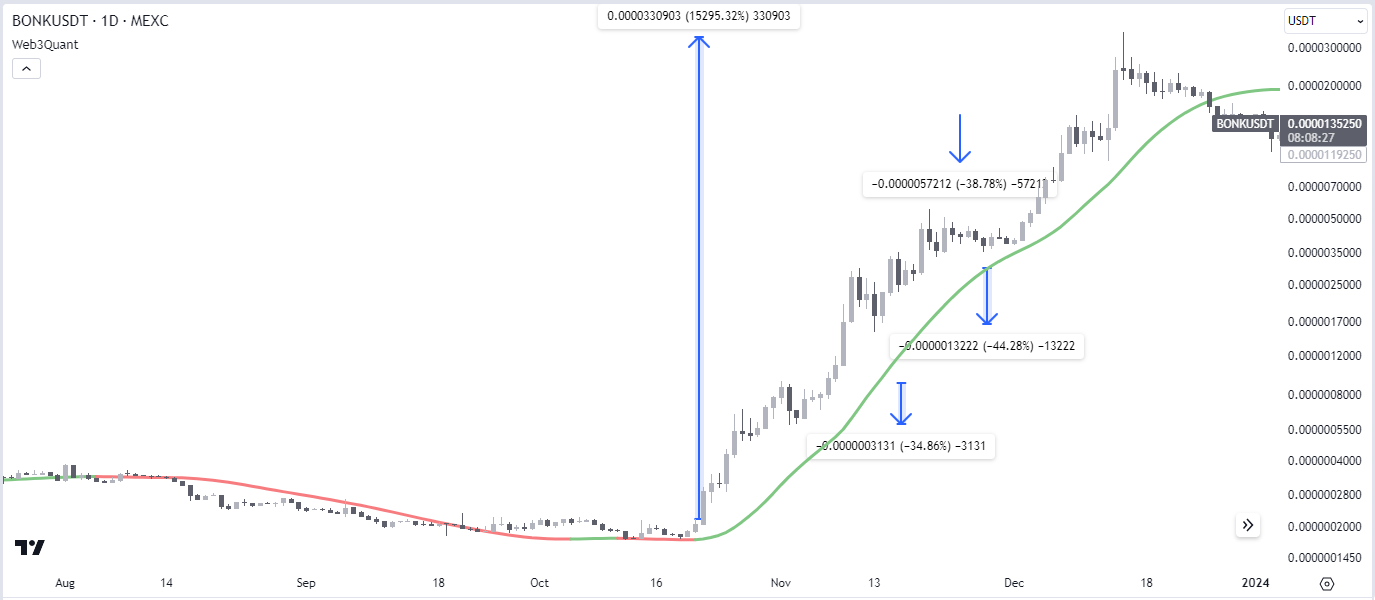
This is BONK chart. Even on a daily TF you see the indicator stayed in the trade for the entire 150X (not a typo).
But there were so many 30%-40% correction in between. You can never get one without the other.
Logically you could have booked profits after it did 10x in 1 month.
It's a lot by any standards but then you would have missed out on the rest.
So there are no easy decision in crypto.
The only quantitative things you can do is either
1. Stick to your timeframe till it gives you an exit. in this case, it would be over 50% lower than the highest high.
- Book profits when the price is away from the line a lot and enter again when it gets closer.
- Operate on LTF. Here's what the indicator did on 8 hours TF. Just once it got faked out.
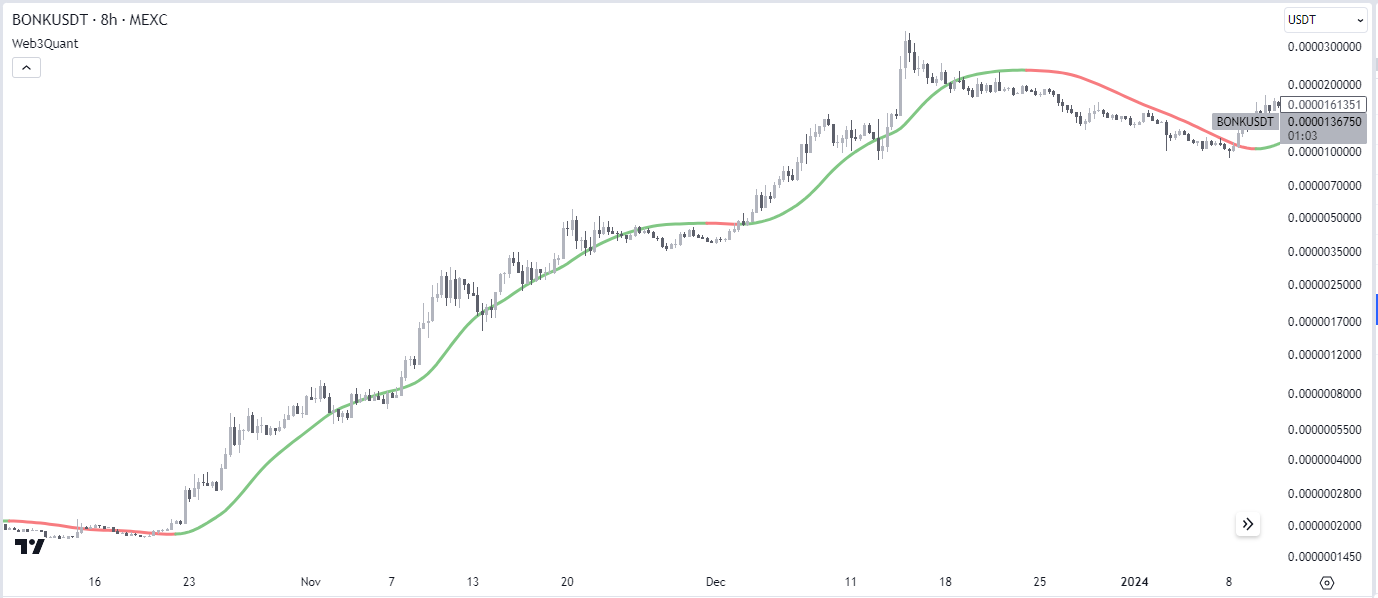
Before you decide. Ah, this great I will use the indicator on the lowest possible timeframe and keep going in and out.
you need to remember the most important thing. COMPOUNDING.
THIS IS REALLY IMP SO PAY ATTENTION
Realistically you will NEVER re-enter with the same size.
In the above example If you started the position in BONK with 10K and did 100K gains in a month you will never enter again with all the 100K during your 2nd reentry.
You will again mostly enter with 10K or a little more. Spread your bets in the "next" bonk (and most likely lose it).
Make another 100k in reentry if you do well so in total 200k.
Lets say you are a genius and extracted 400k. Thats great.
Meanwhile, someone who is operating on a higher timeframe and is sitting through gut-churning volatility is likely to make 1 million on the same trade even if the exited 50% lower than the highest high.
Now add taxes, slippage, etc.
Once you truly internalize it. You will only trade differently.
NOTE: Bonk is also one of my no-brainer cycle play (value) and i have used exaggerated numbers to make a point.
Hope you find some value out of it.
Remember trading is the world's most competitive sport. You are going head-to-head against the best and the brightest. As you are upgrading your selves with knowledge so are others.
Keep learning. Stay Sharp. All the best.
W3Q
** Web3Quant is not registered with any financial regulatory agencies. Web3Quant content is purely for research, education, and entertainment purposes and should NOT be considered personalized financial advice. Do your own research and consult your financial advisor.**